Arlington, VA
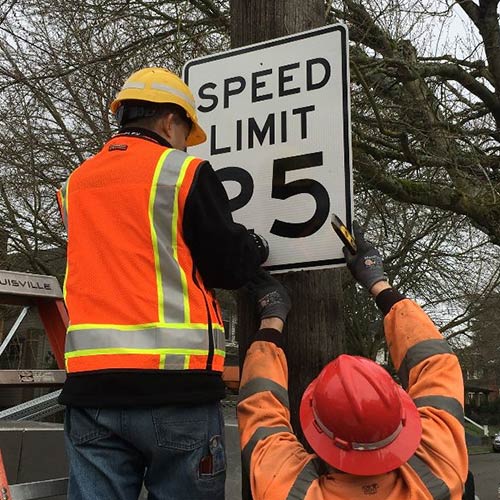
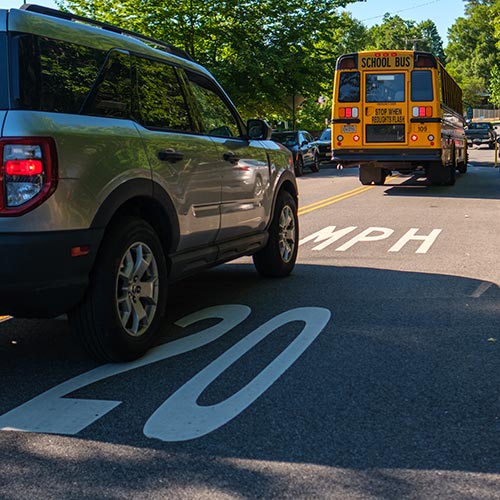
Intersection and speed solutions
Injuries associated with road transportation represent a public health crisis in the United States and an area where we are falling far behind our international peers. Despite decades of incremental improvements, fatal and serious injury crashes remain unacceptably high, especially for pedestrians and others who lack the protection of a vehicle.
Clearly, the current playbook — largely reactive, siloed and site-specific — is not delivering effective population-scale safety results. Decisions about transportation planning, safety and operations and about land development are often made independently of one another, even though they all help shape the fundamental conditions that determine injury risk. To achieve meaningful progress, we must move beyond making changes in response to individual crashes and instead proactively address the underlying causes of traffic deaths and serious injuries.
Put simply, speed kills. Kinetic energy is the central driver of injury in road collisions. As the amount of kinetic energy in a crash increases, whether through higher velocity or greater mass, the human body is less able to tolerate the forces released. Kinetic energy risk can be managed by reducing how often and how far people drive (exposure), limiting operating speeds and vehicle mass (severity), and reducing how often road users are placed in conflict (likelihood of a crash).
The Safe Systems Pyramid developed by Ederer et al. (2023) illustrates how system design at the socioeconomic and built environment levels — not individual behavior — sets the stage for these risk conditions and thus offers opportunities for the most impactful interventions.
Proactive injury prevention therefore starts upstream. One key element is managing exposure through reductions in vehicle miles traveled (VMT) via shifts to shorter trips and away from private motor vehicles. Another is setting and managing context-sensitive target speeds to survivable levels. A third is designing streets and networks that reduce conflicts by separating road users in space or time. With these system-level design improvements, the safe choice becomes the natural choice, strengthening the overall performance of complementary measures such as enforcement and vehicle safety technologies.
This compilation of case studies illustrates how state and local agencies are taking a proactive injury prevention approach. They are systematically monitoring and addressing exposure, severity and likelihood of a crash and shifting from isolated fixes toward coordinated, system-level strategies that can prevent severe injuries.
The case studies are designed for agency staff, practitioners, advocates and elected officials. Agency staff and practitioners can draw on them as practical models for justifying and implementing changes in policy, design, operations and planning. Advocates can use them to demonstrate what proactive, multilayered safety improvements look like. Elected officials can use them as models of clear, feasible decisions that reduce serious injuries and advance community goals.
The examples highlight the three main levers agencies can pull to reduce serious injuries. They can reduce injury risk factors by limiting the risk factors described above:

Exposure
how much people drive

Severity
how fast vehicles travel and how heavy they are

Likelihood of a crash
how often road users come into conflict
Each case study identifies one primary lever that was applied and, where relevant, one or two secondary levers.
Download all case studies here or by individual community below.
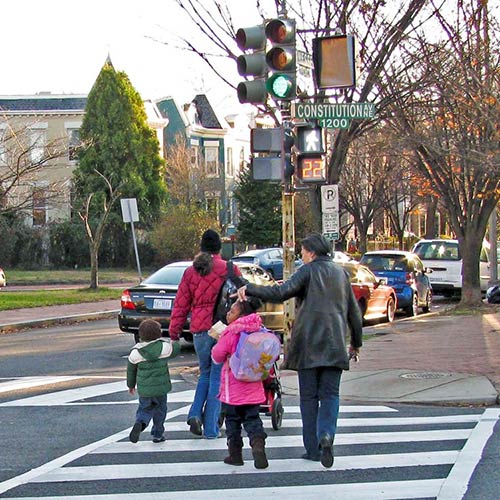
Arlington, VA
Intersection and speed solutions
Austin, TX
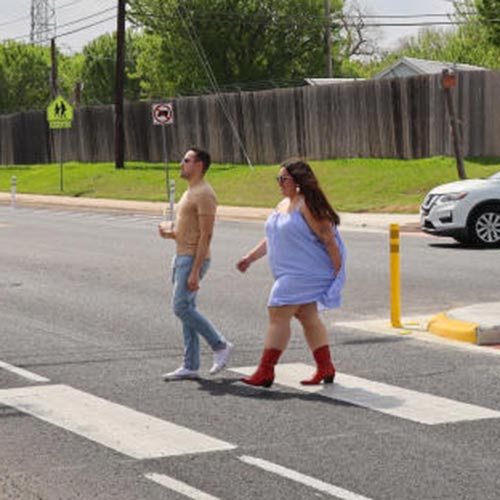
Shifting safety decision-making upstream


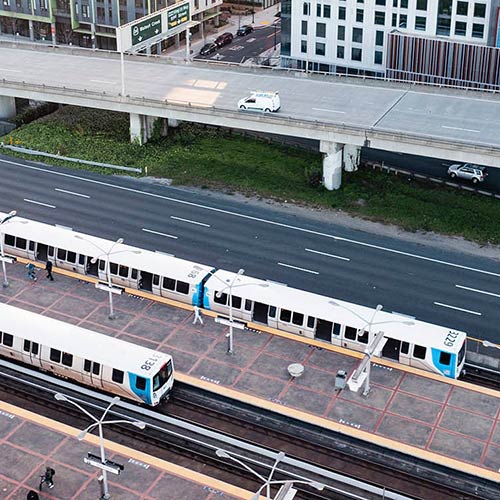
California
Altering development patterns
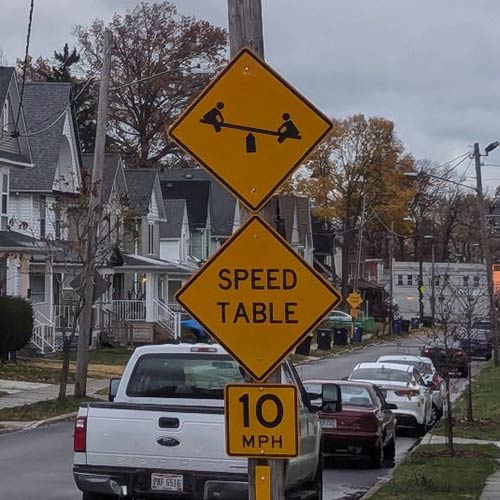
Cleveland
Scaling up speed tables
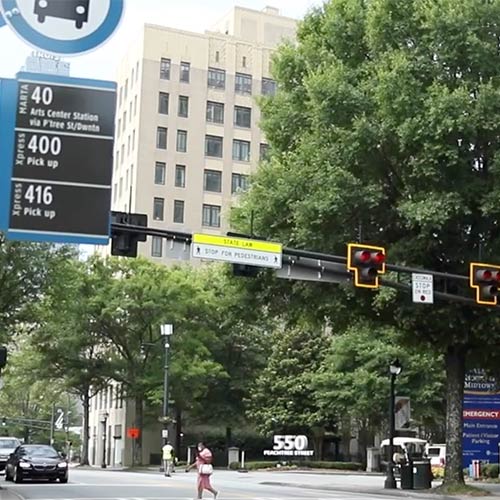
Georgia
Systemic safety strategies
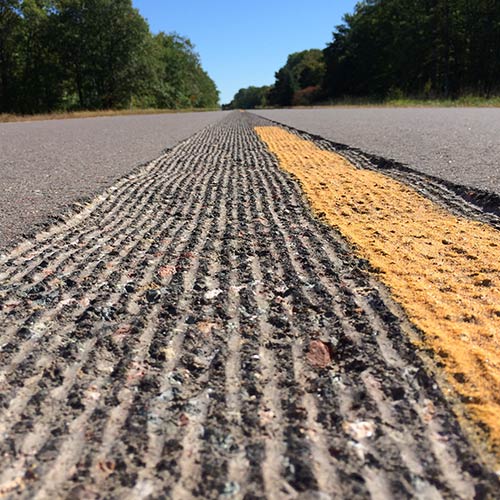
Minnesota
Centerline rumble strips
Montgomery County, MD
Predictive analysis
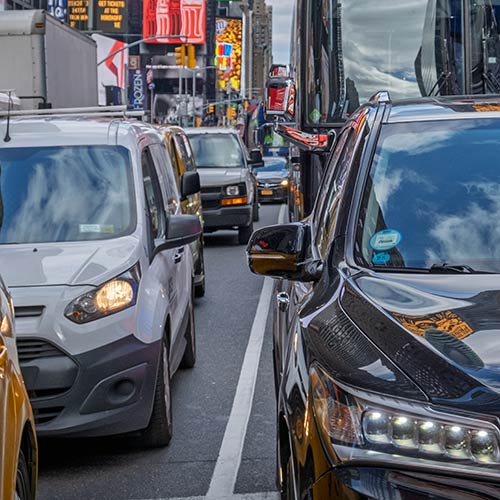
New York City
Congestion pricing
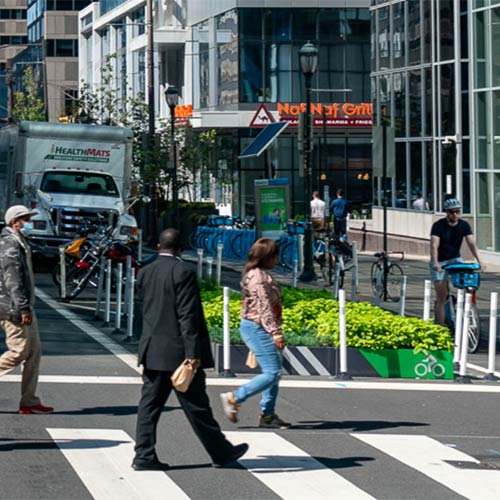
Philadelphia
Redesigning for slower speeds
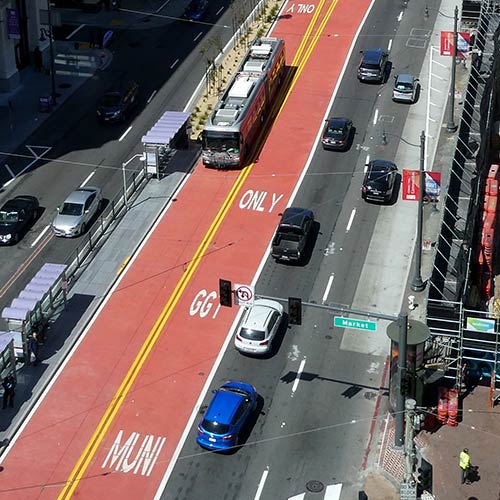
San Francisco
Transit-only lanes
Santa Rosa, CA
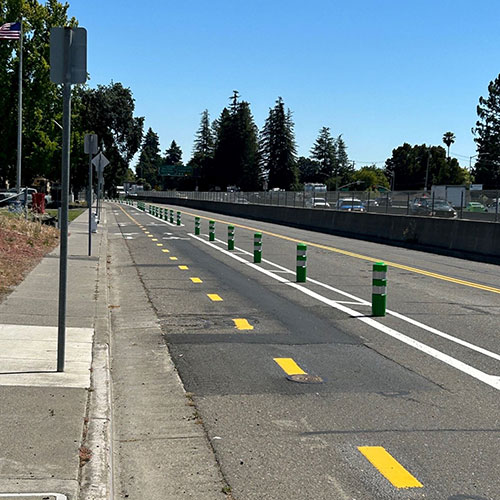
Institutionalizing Safe System tenets

Washington state
Intelligent speed assistance
Some of these case studies share a powerful trait: They address the “trifecta” of exposure, severity, and likelihood simultaneously, producing compounding safety benefits. Fehr & Peers has described these as safety multipliers — packages of interventions whose components reinforce each other to deliver outcomes greater than the sum of their parts.
San Francisco’s Van Ness Improvement Project is a prime example: Transit-only lanes reduced vehicle volumes (exposure); lane narrowing, median refuges and bulb-outs brought speeds closer to survivable thresholds (severity); and leading pedestrian intervals and turn restrictions reduced the chance that the remaining interactions turned into crashes (likelihood).
Identifying and prioritizing safety multipliers is one of the most important things an agency can do to get more out of limited safety budgets. Strategies that act across multiple safety levers often provide stronger and more resilient returns than those focused on a single lever; the compounding protection means the system keeps working even when individual elements underperform.
This blog post from Fehr & Peers provides an in-depth discussion of safety multiplier strategies, along with real-world examples and implementation guidance.
This video from the California State Transportation Agency and the California Health and Human Services Agency explains how the state is applying Safe System principles through transportation, housing and land-use policies, as described in the California case study.